
By Harry Ferdon, Economist
Equilibrium Displacement Models 101: Measuring the Impact of Supply and Demand Shifts
Often times, folks will consider the direct cost of an external policy/shock to an industry, such as a new regulation, in terms of the total costs incurred by businesses and interpret these as the total economic effect. However, this does not consider how market price and quantity will change with this shift in supply, which depends on both the demand for the product, as well as supply-side dynamics, such as how cost-sensitive suppliers are. A market model (sometimes called equilibrium displacement model) can be used to capture these shifts, as well as to estimate changes in consumer and producer surplus, and total industry output. Combining a market model with a multiplier analysis can provide a complete picture of the total economic effects.
Basic Supply and Demand
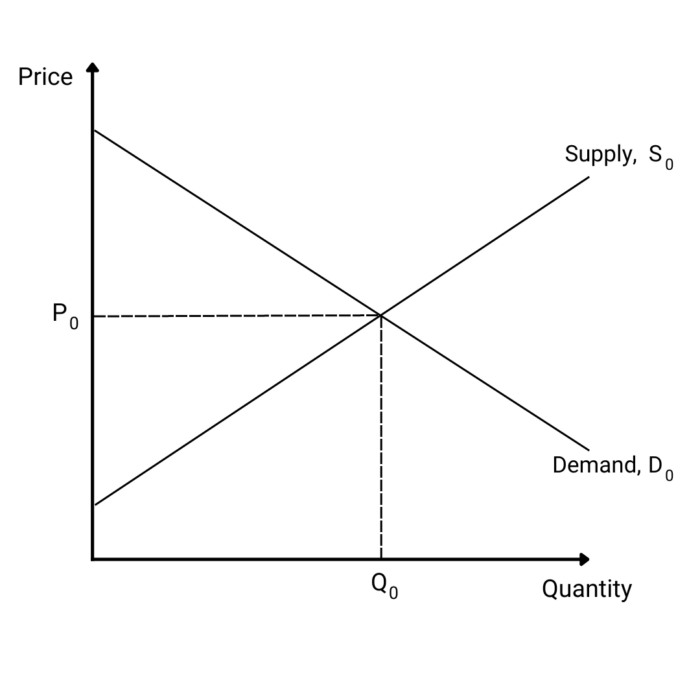
Those of us who have taken economics courses are introduced to supply and demand using the simple graph shown below (Figure 1a) – an upward sloping supply curve, downward sloping demand curve, and market price and quantity at the point where supply equals demand. Demand represents consumer willingness to pay and the supply curve represents the marginal cost to produce the product.
Shifts in Supply and Demand
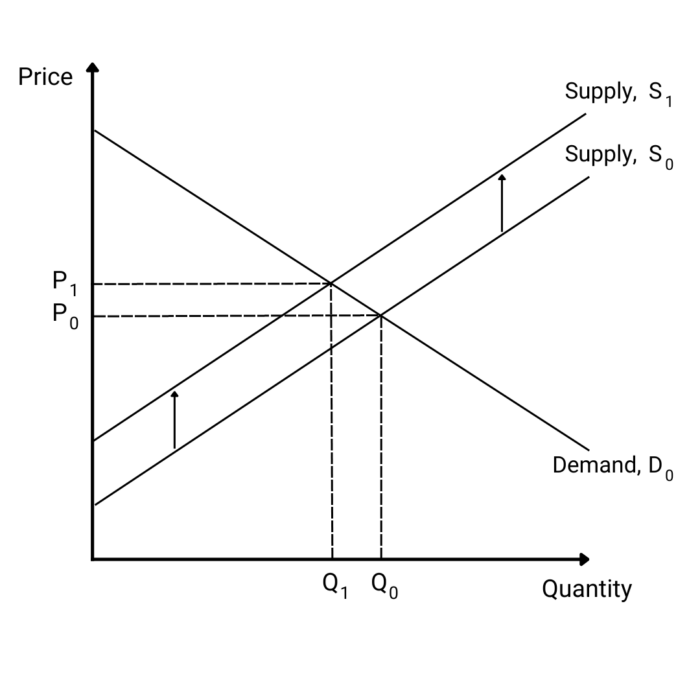
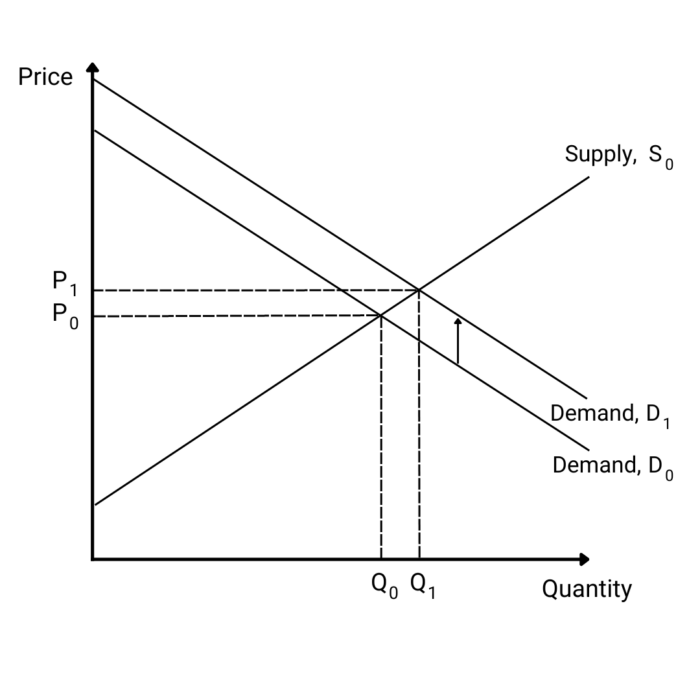
Shifts in supply and demand can occur due to a wide range of external factors. For example, if suppliers incur new added costs in order to comply with a new regulation, this increases MC at each point on the supply curve and shifts the entire curve up. This is shown below in Figure 1b. This supply shift would result in an increase in price and decrease in quantity. As another example, a new technology or other innovation could improve a product’s quality such that the consumer willingness to pay is greater at each point on the demand curve. This shifts the entire demand curve up, as shown in Figure 1c. This demand shift results in an increase price and an increase in quantity.
In practice, estimating the industry supply and demand curve requires careful economic analysis. What we do typically observe is the current price and industry output, and some idea of how quantity supplied/demanded changes with price. This change is quantified using estimates of price elasticity.
Price Elasticity
Price elasticities measure the percent change in quantity per percent change in price. The price elasticity of demand, therefore, is the percent change in quantity demanded per percent change in price (e.g., a price elasticity of demand of -2 means that for every 10% increase in price, quantity demanded decreases by 20%). Supply elasticity is the percent change in quantity supplied per percent change in price (e.g., a price elasticity of supply of 0.5 means that for every 10% increase in price, there is a 5% increase in produced quantity). Cross-price elasticities show the percent change in quantities associated with percent changes in prices of other goods. Income elasticity shows the percent change in quantity per percent change in income.
Equilibrium Displacement Model (Market Model)
An equilibrium displacement model (market model) uses existing market conditions (price and quantity) and available elasticity data to evaluate the potential changes in equilibrium prices and quantities due to shifts in supply and/or demand. This tool allows economists to study how an exogenous (external) factor, such as a new regulation, impact the price and quantity of a specific crop or product.
ERA has used equilibrium displacement models for a variety of use cases, projects, and clients. Farming groups concerned with the impacts of stricter requirements by their buyers can see how these added costs affect not only them but the end consumers. Trade associations have been able to show how new regulations could negatively impact both producers and consumers, and therefore result in less tax revenue for the government issuing them. Equilibrium displacement models are also used for economic and fiscal impact analyses conducted as part of the rulemaking process in California. ERA has used them for different agencies and industries (e.g., cannabis) to quantify and disclose the broader market impacts of a new regulation before it is implemented. These are just a few examples of the ways this tool can be used to help answer important industry-related questions affecting economic impacts.
If you’re interested to talk more about a market model, please contact Harry Ferdon.